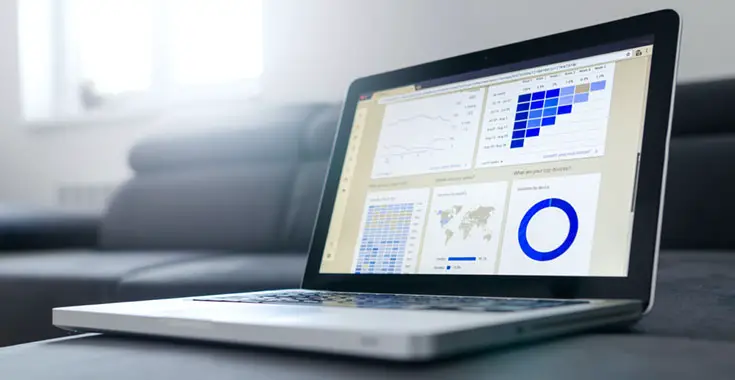
The ability to see and understand how your company’s operations and financials are faring on a near-real-time basis can help managers and executives make better business decisions. They can more efficiently track and understand the performance of their organization, identify problems and potential for improvement, and ultimately increase operational efficiency.
Digital dashboards give companies a view of the performance of their entire business - in this case from the supplier, through manufacturing, and ultimately to the consumer. Learn about how you can leverage digital dashboards to help your business see more clearly, better manage your operations and ultimately improve your business results.
What kinds of data Do Digital Dashboards provide?
Digital dashboards give companies a view of the performance of their entire business. Through the use of real-time information and data visualization, solutions by Grid Dynamics provide the means to track and manage the performance of all the key operations, including business-critical KPIs. Thus, you can track delivery times, inventory levels, order fulfillment rates, customer satisfaction, and more general indicators, such as overall performance and forecast profitability.
How can Digital Dashboards help managers and executives?
Digital dashboards can help managers and executives make better business decisions by giving them a real-time view of business operations and performance indicators. Through the use of real-time information and data visualization, digital dashboards provide the means to track and manage the performance of these operations.
Digital dashboards can be used to help executives make the following decisions:
- Increase business efficiency by quickly identifying and addressing inefficiencies or bottlenecks in the operations. For example, they can provide a view of inventory levels and inventory shrink rates that will help managers make informed decisions about purchasing, restocking, and ordering.
- Help managers and executives monitor the performance of key operations to gain a competitive edge in terms of responsiveness and efficiency. For example, they can allow managers to quickly understand and act on a customer’s order, providing a view of delivery times and order fulfillment rates.
- Increase efficiency by quickly identifying problems in their operations and helping managers and executives quickly respond to the issues. For example, digital dashboards can provide a view of the performance of their operations and allow managers to identify potential issues in their operations in real-time, such as unexpected inventory levels or unexpected delivery times.
What types of software do Digital Dashboards use?
Digital dashboards use a variety of software platforms to manage and display their data. As a rule, such digital solutions include real-time analytics tools and online analytical processing (OLAP), among others.
- Real-time analytics tools provide the ability to quickly create a dashboard based on real-time data. For example, they provide a means to create an efficient digital dashboard based on information coming from sales, inventory management, manufacturing, and financial reporting.
- Online analytical processing (OLAP) is a type of software used to analyze and retrieve information from databases. It allows users to build a dashboard based on any combination of metrics that they have available. For example, if a company has information on customers, products, orders, shipments, inventory levels, and financial data, it can create dashboards from any combination of these metrics.
The software platforms used to create and display dashboards may be hosted on-premises, in the cloud, or used in a hybrid setting.
Creating dashboards with Data Visualization tools and technologies
Data visualization tools and technologies can help data to take shape and become more understandable. You can use data visualization tools in order to have information about customers, products, orders, shipments, inventory levels, financial data, and more displayed in a simple, meaningful way. Thus, you will be able to clearly see the situation, track the progress, and make decisions accordingly.
As the use of real-time analytics and data visualization becomes more commonplace, it is expected that data visualization will step out as a more important tool for users in terms of dashboards creation. Businesses can now configure different dashboard views as per their needs and adjust them for different types of users.
Conclusion
The growth in the popularity of big data, the Internet of Things, and data visualization technologies means that dashboard creation and management will continue to play an increasingly important role in helping users understand how their company is performing. And you have the great opportunity to employ all the digital solutions to the benefit of your business.


